Hola,
Hoy estaré compartiendo las mejoras que he realizado a la herramienta para diagramar la infraestructura de Veeam Backup & Replication. Esta herramienta utiliza Graphviz
como motor para dibujar el diagrama y el módulo de PSGraph
para generar el código desde PowerShell. Aquí les dejo el enlace del proyecto en GitHub:
Esta herramienta es utilizada dentro del reporte de AsbuiltReport.Veeam.VBR para generar el diagrama de los siguientes componentes:
- VMware and Hyper-V Proxy
- Tape Infrastructure
- Backup Repositories
- SOBR repositories
- Wan Accelerators
- etc..
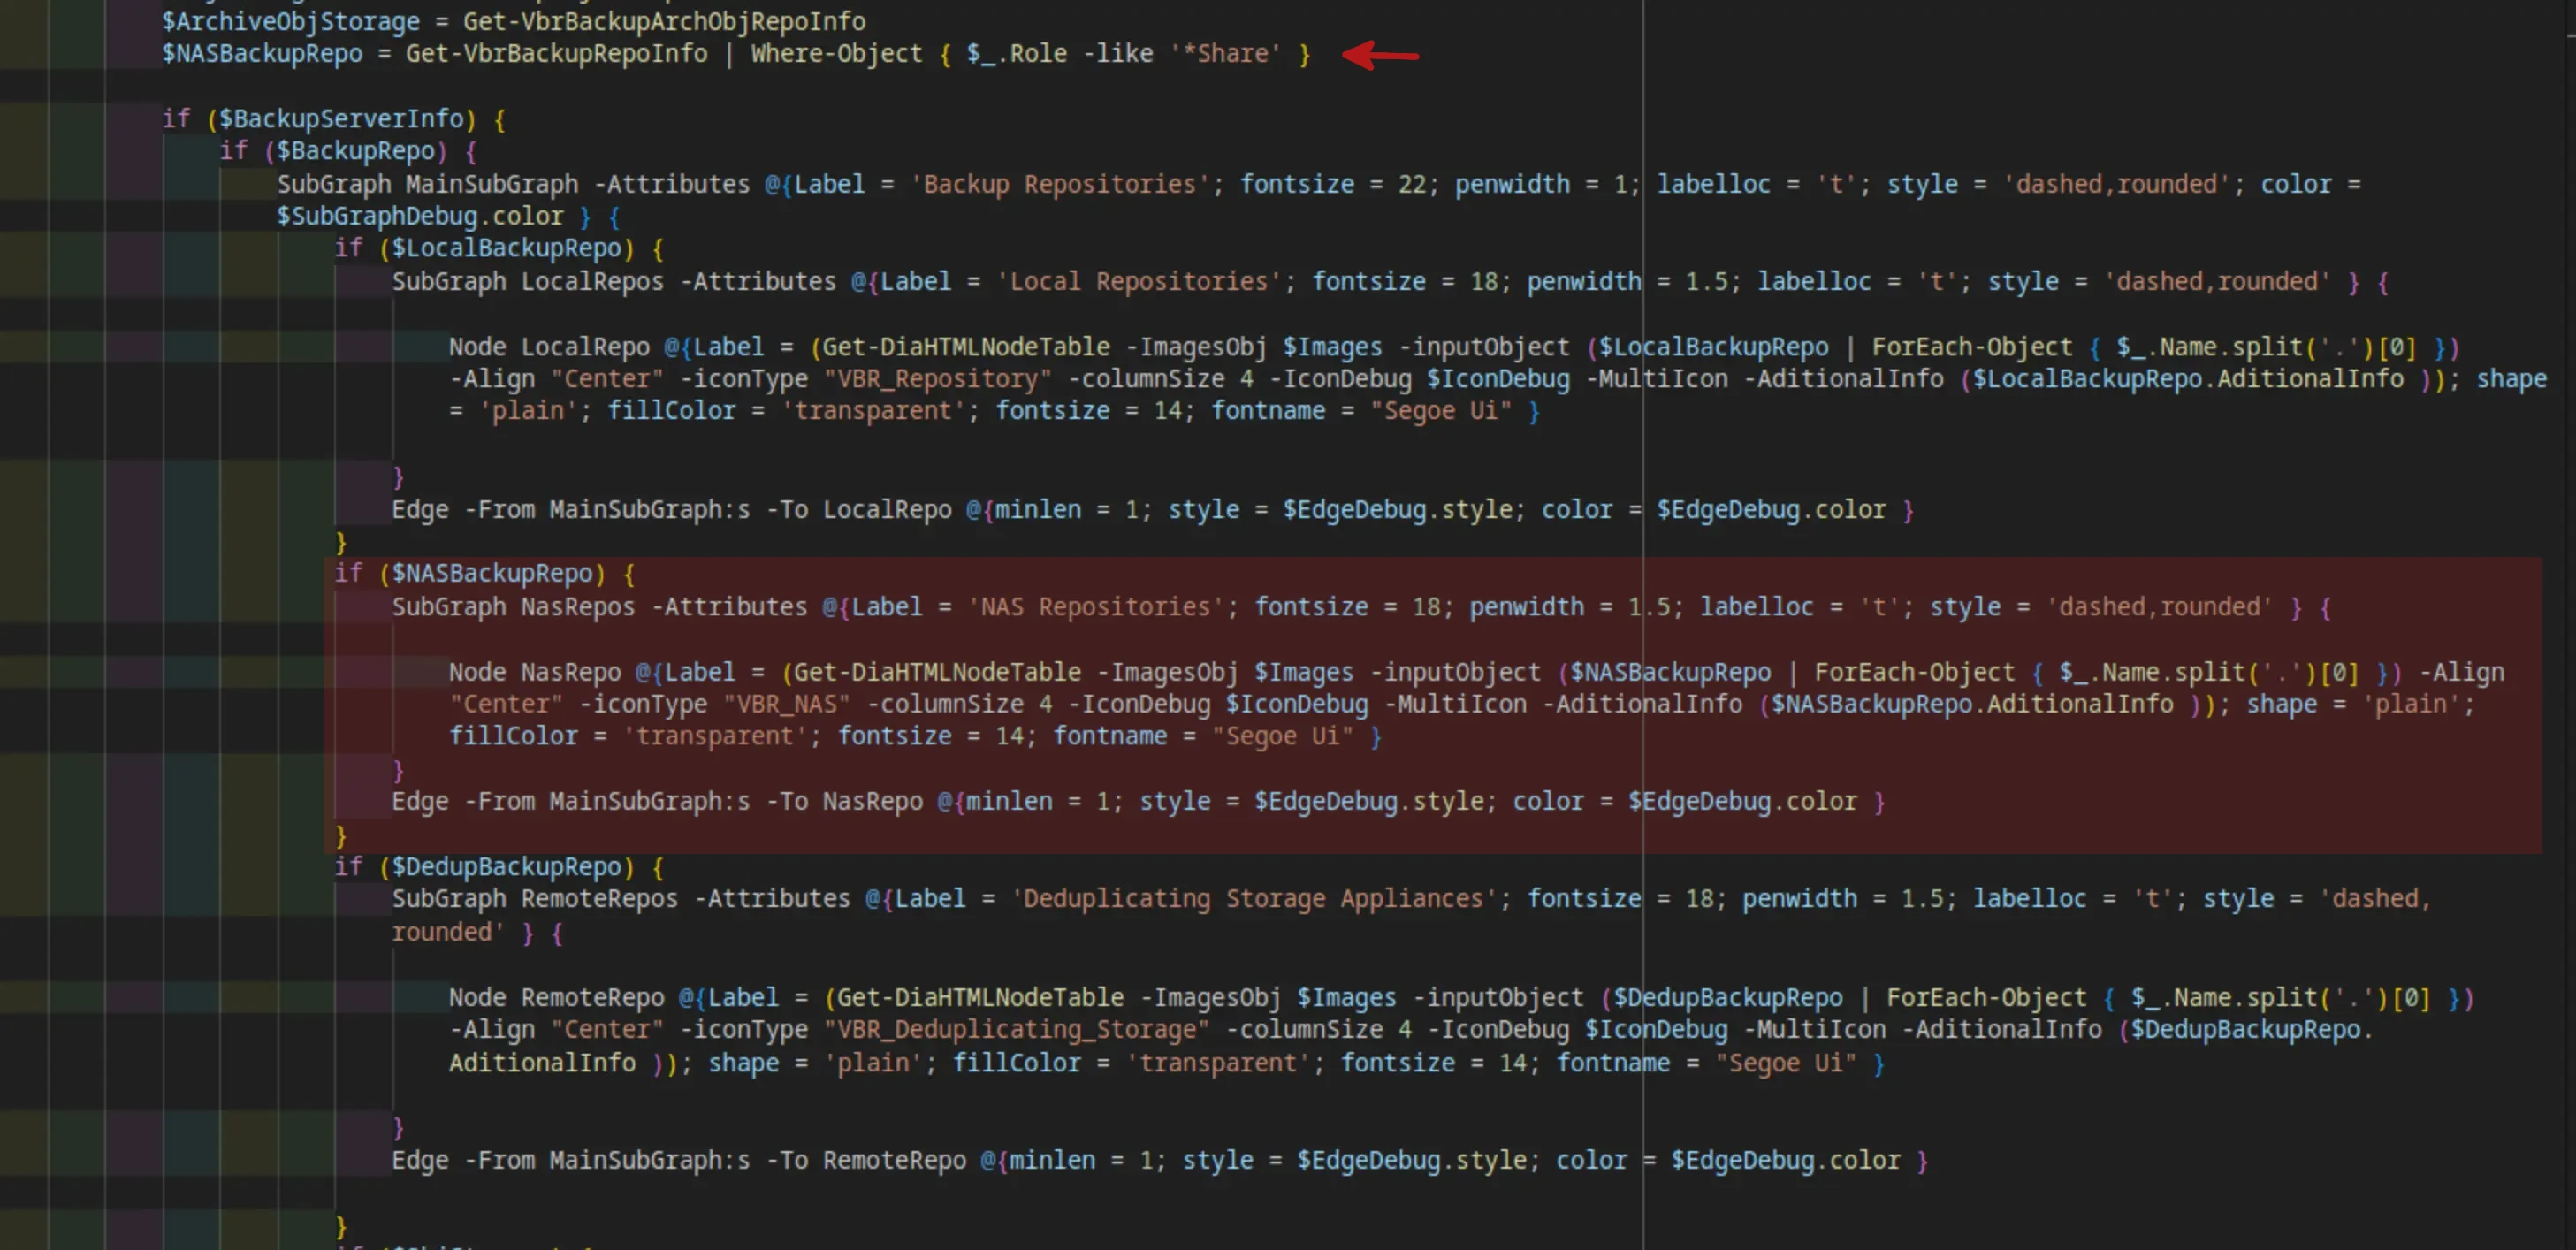
En la versión 0.6.1 se añadió al diagrama los repositorios tipo NAS (SMB y NFS) que antes de esta versión no habían sido identificados en el código.
Aquí les dejo el código añadido en esta versión: Enlace :

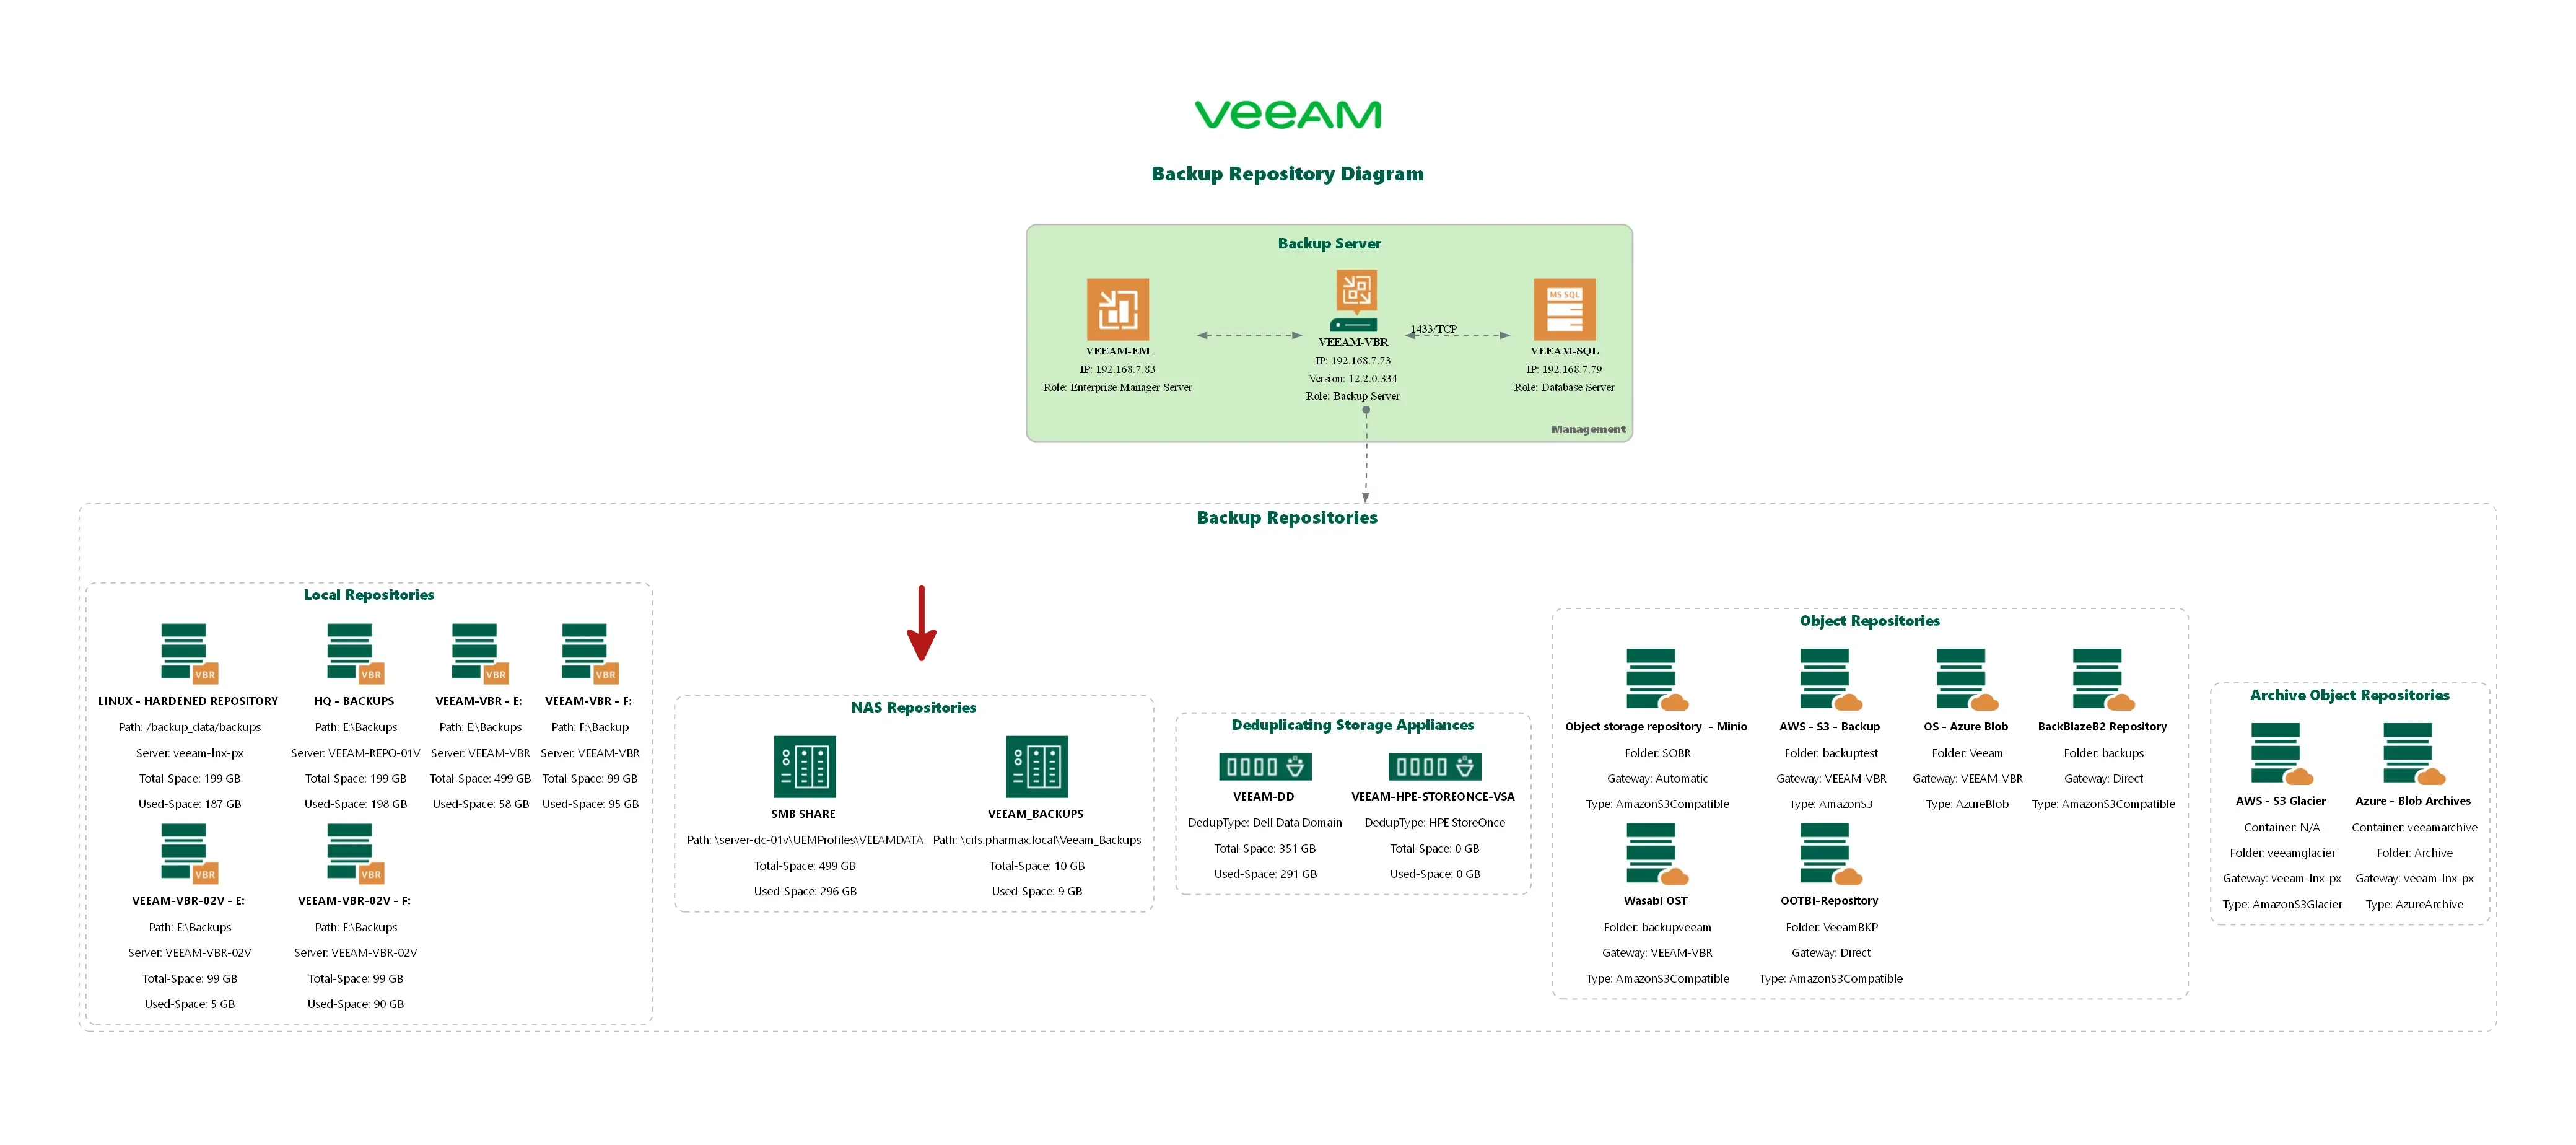
En la siguiente imagen se puede ver los componentes de NAS identificados dentro del diagrama.

Otra mejora al código es la detección de la versión del módulo de PowerShell de Veeam. Anteriormente, no se detectaba correctamente esta versión:

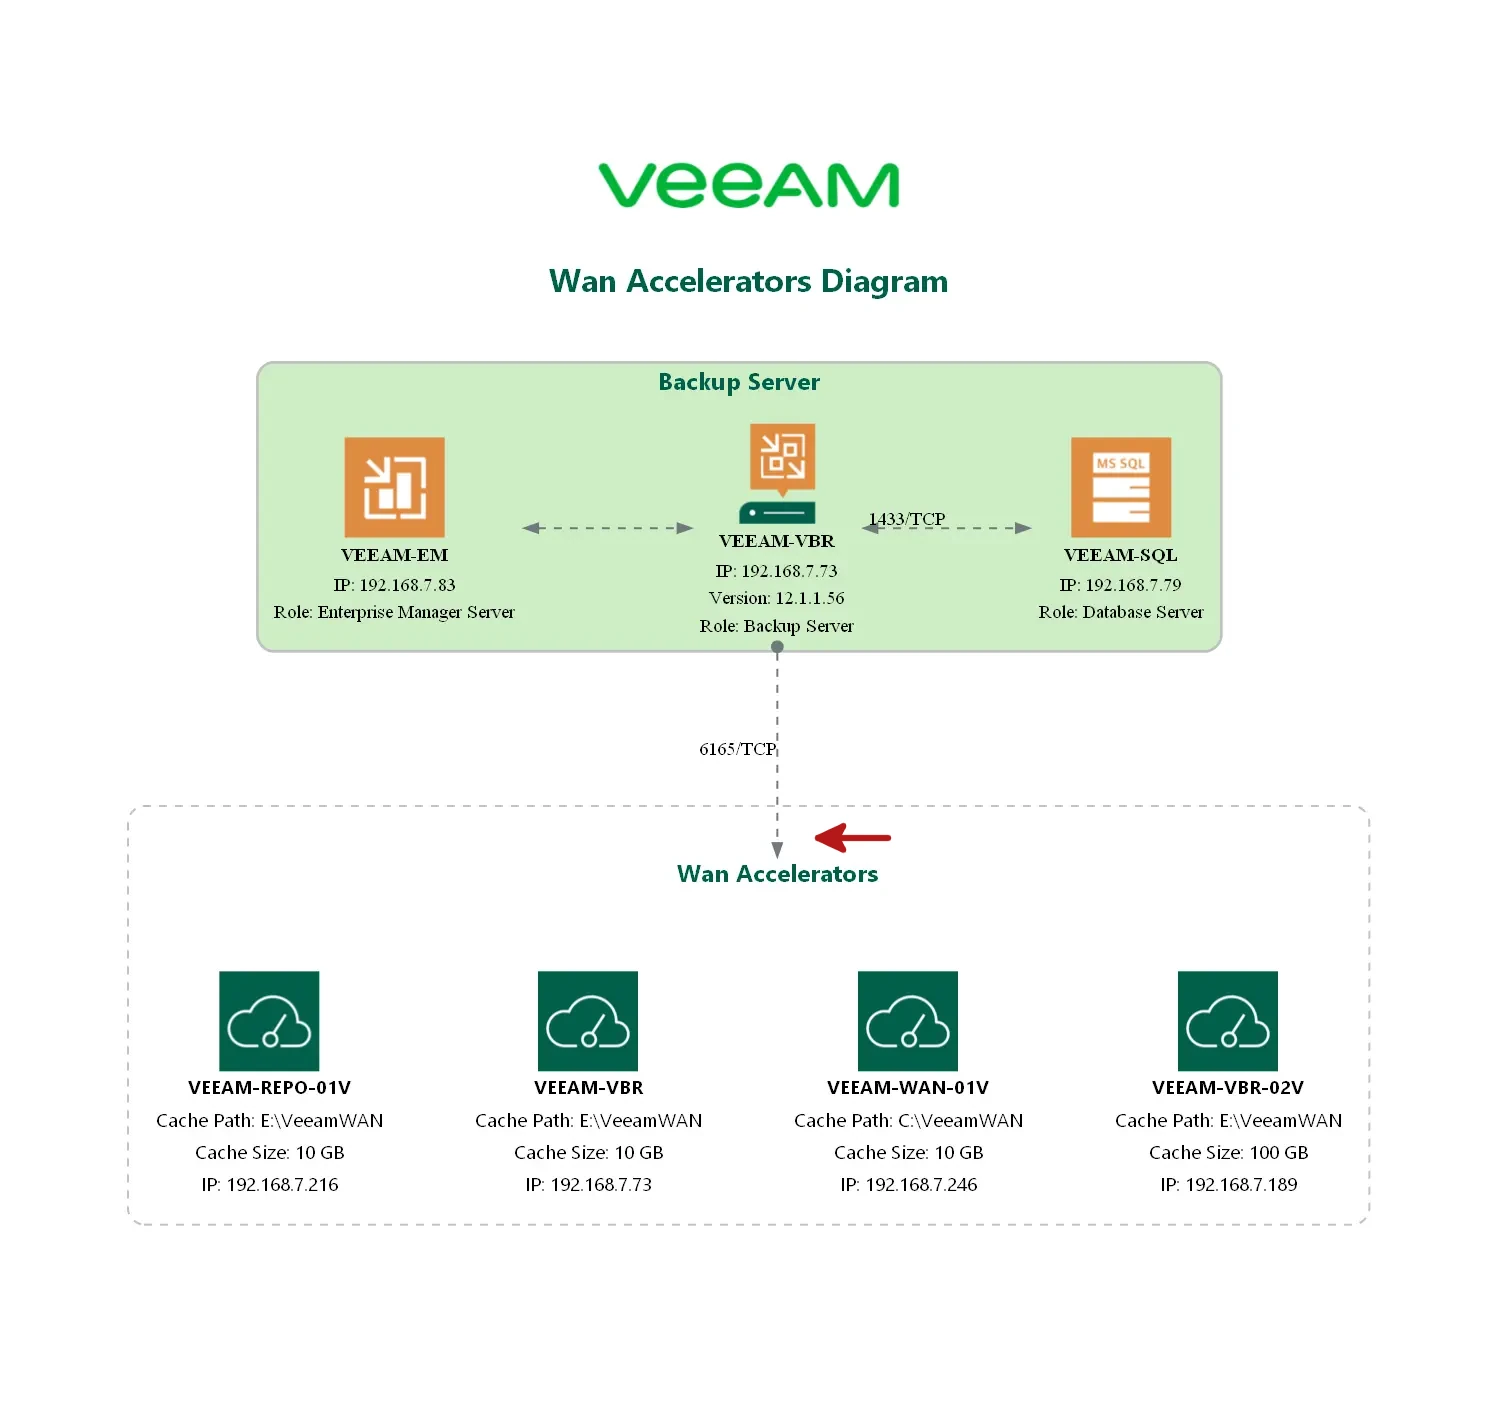
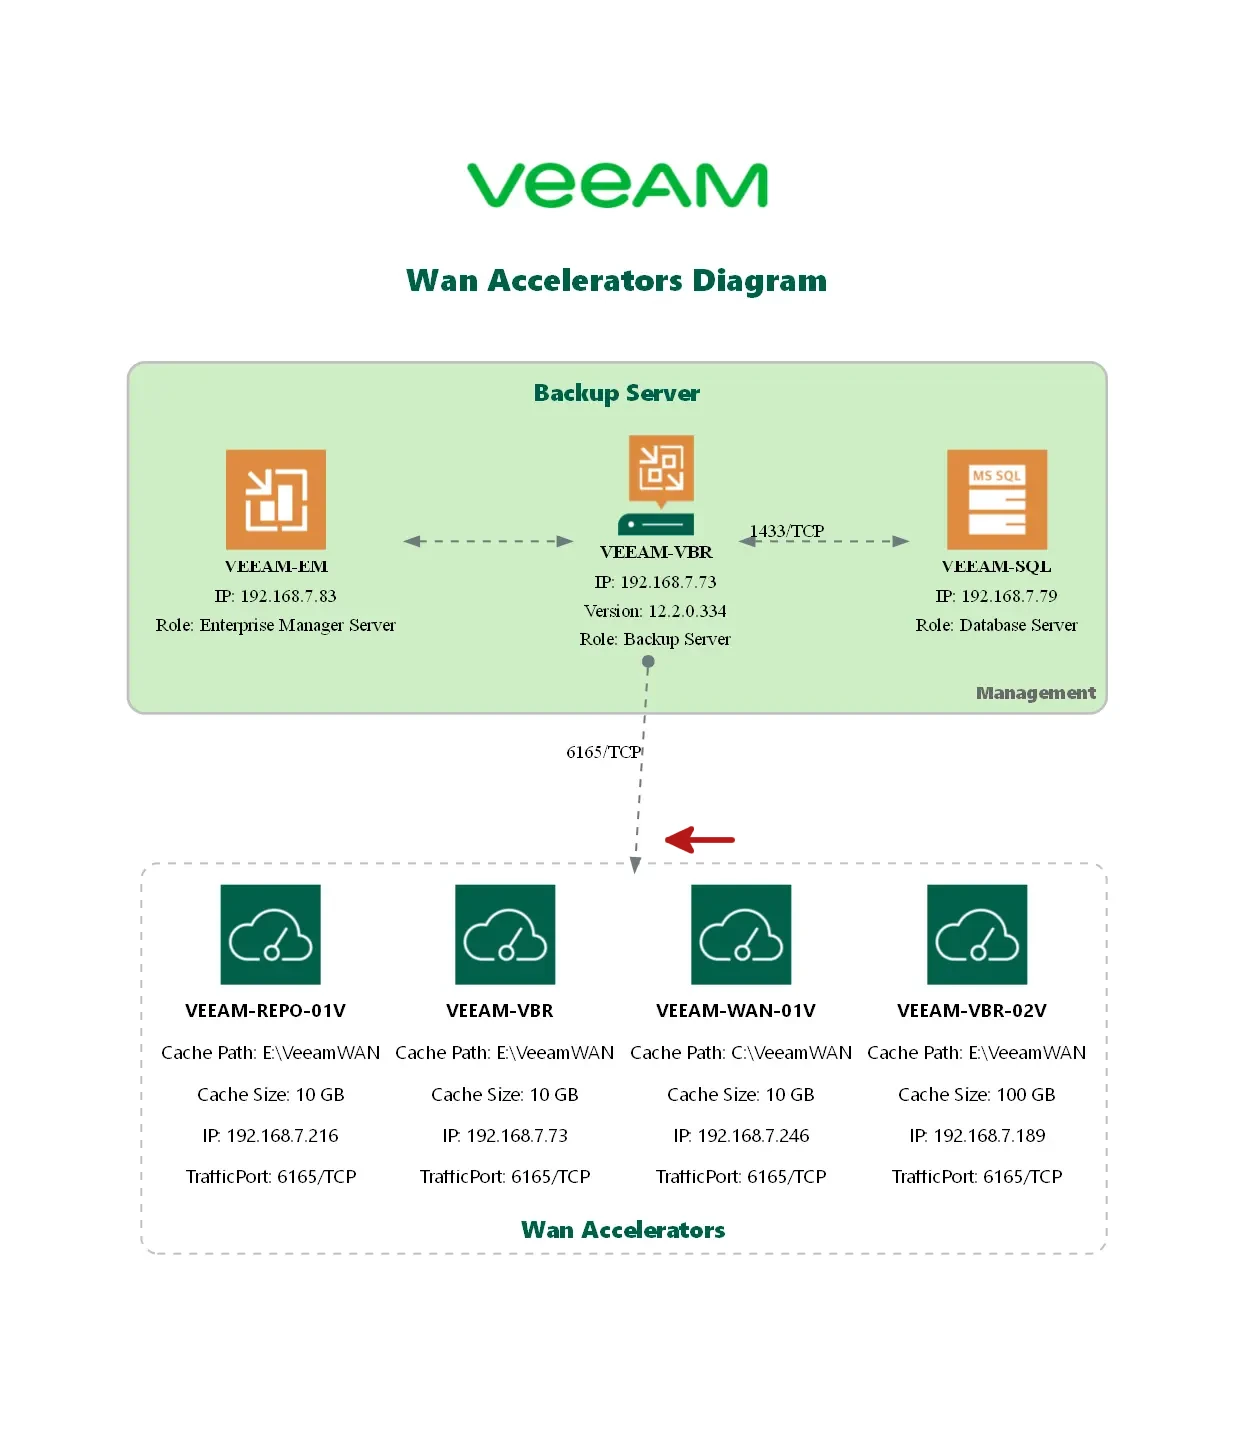
Dentro de Graphviz existe un concepto llamado Cluster que es utilizado para agrupar los objetos dentro del diagrama. En las versiones previas era difícil codificar un enlace entre estos Clusters, pero en esta nueva versión se añadió la opción de poder hacer enlaces entre estos.
Antes de la versión 0.6.1

Ahora en la versión 0.6.1

El último cambio que discutiré no está relacionado directamente a Veeam.Diagrammer, sino a una dependencia llamada Diagrammer.Core. En esta nueva versión se añadió soporte a la versión 0.2.3 de Diagrammer.Core. En esta nueva versión se añade soporte a Graphviz v12.1, aquí les dejo el enlace de las nuevas capacidades de esta herramienta:
Para finalizar, aquí les dejo el resto de los cambios que se introdujeron o se arreglaron en la nueva versión de Veeam.Diagrammer:
## [0.6.2] - 2024-08-31

### Changed

- Migrate diagrams to use Get-DiaHTMLNodeTable

## [0.6.1] - 2024-08-31

### Added

- Add support for NAS Repository (Backup-to-Repository)

### Changed

- Allow EDGE to connect between Subgraph Clusters
- Update Diagrammer.Core minimum to v0.2.3

### Fixed

- Fix veeam module version detection
¡Hasta la Próxima!

